

Published 11 July 2025. Updated 25 October 2026.
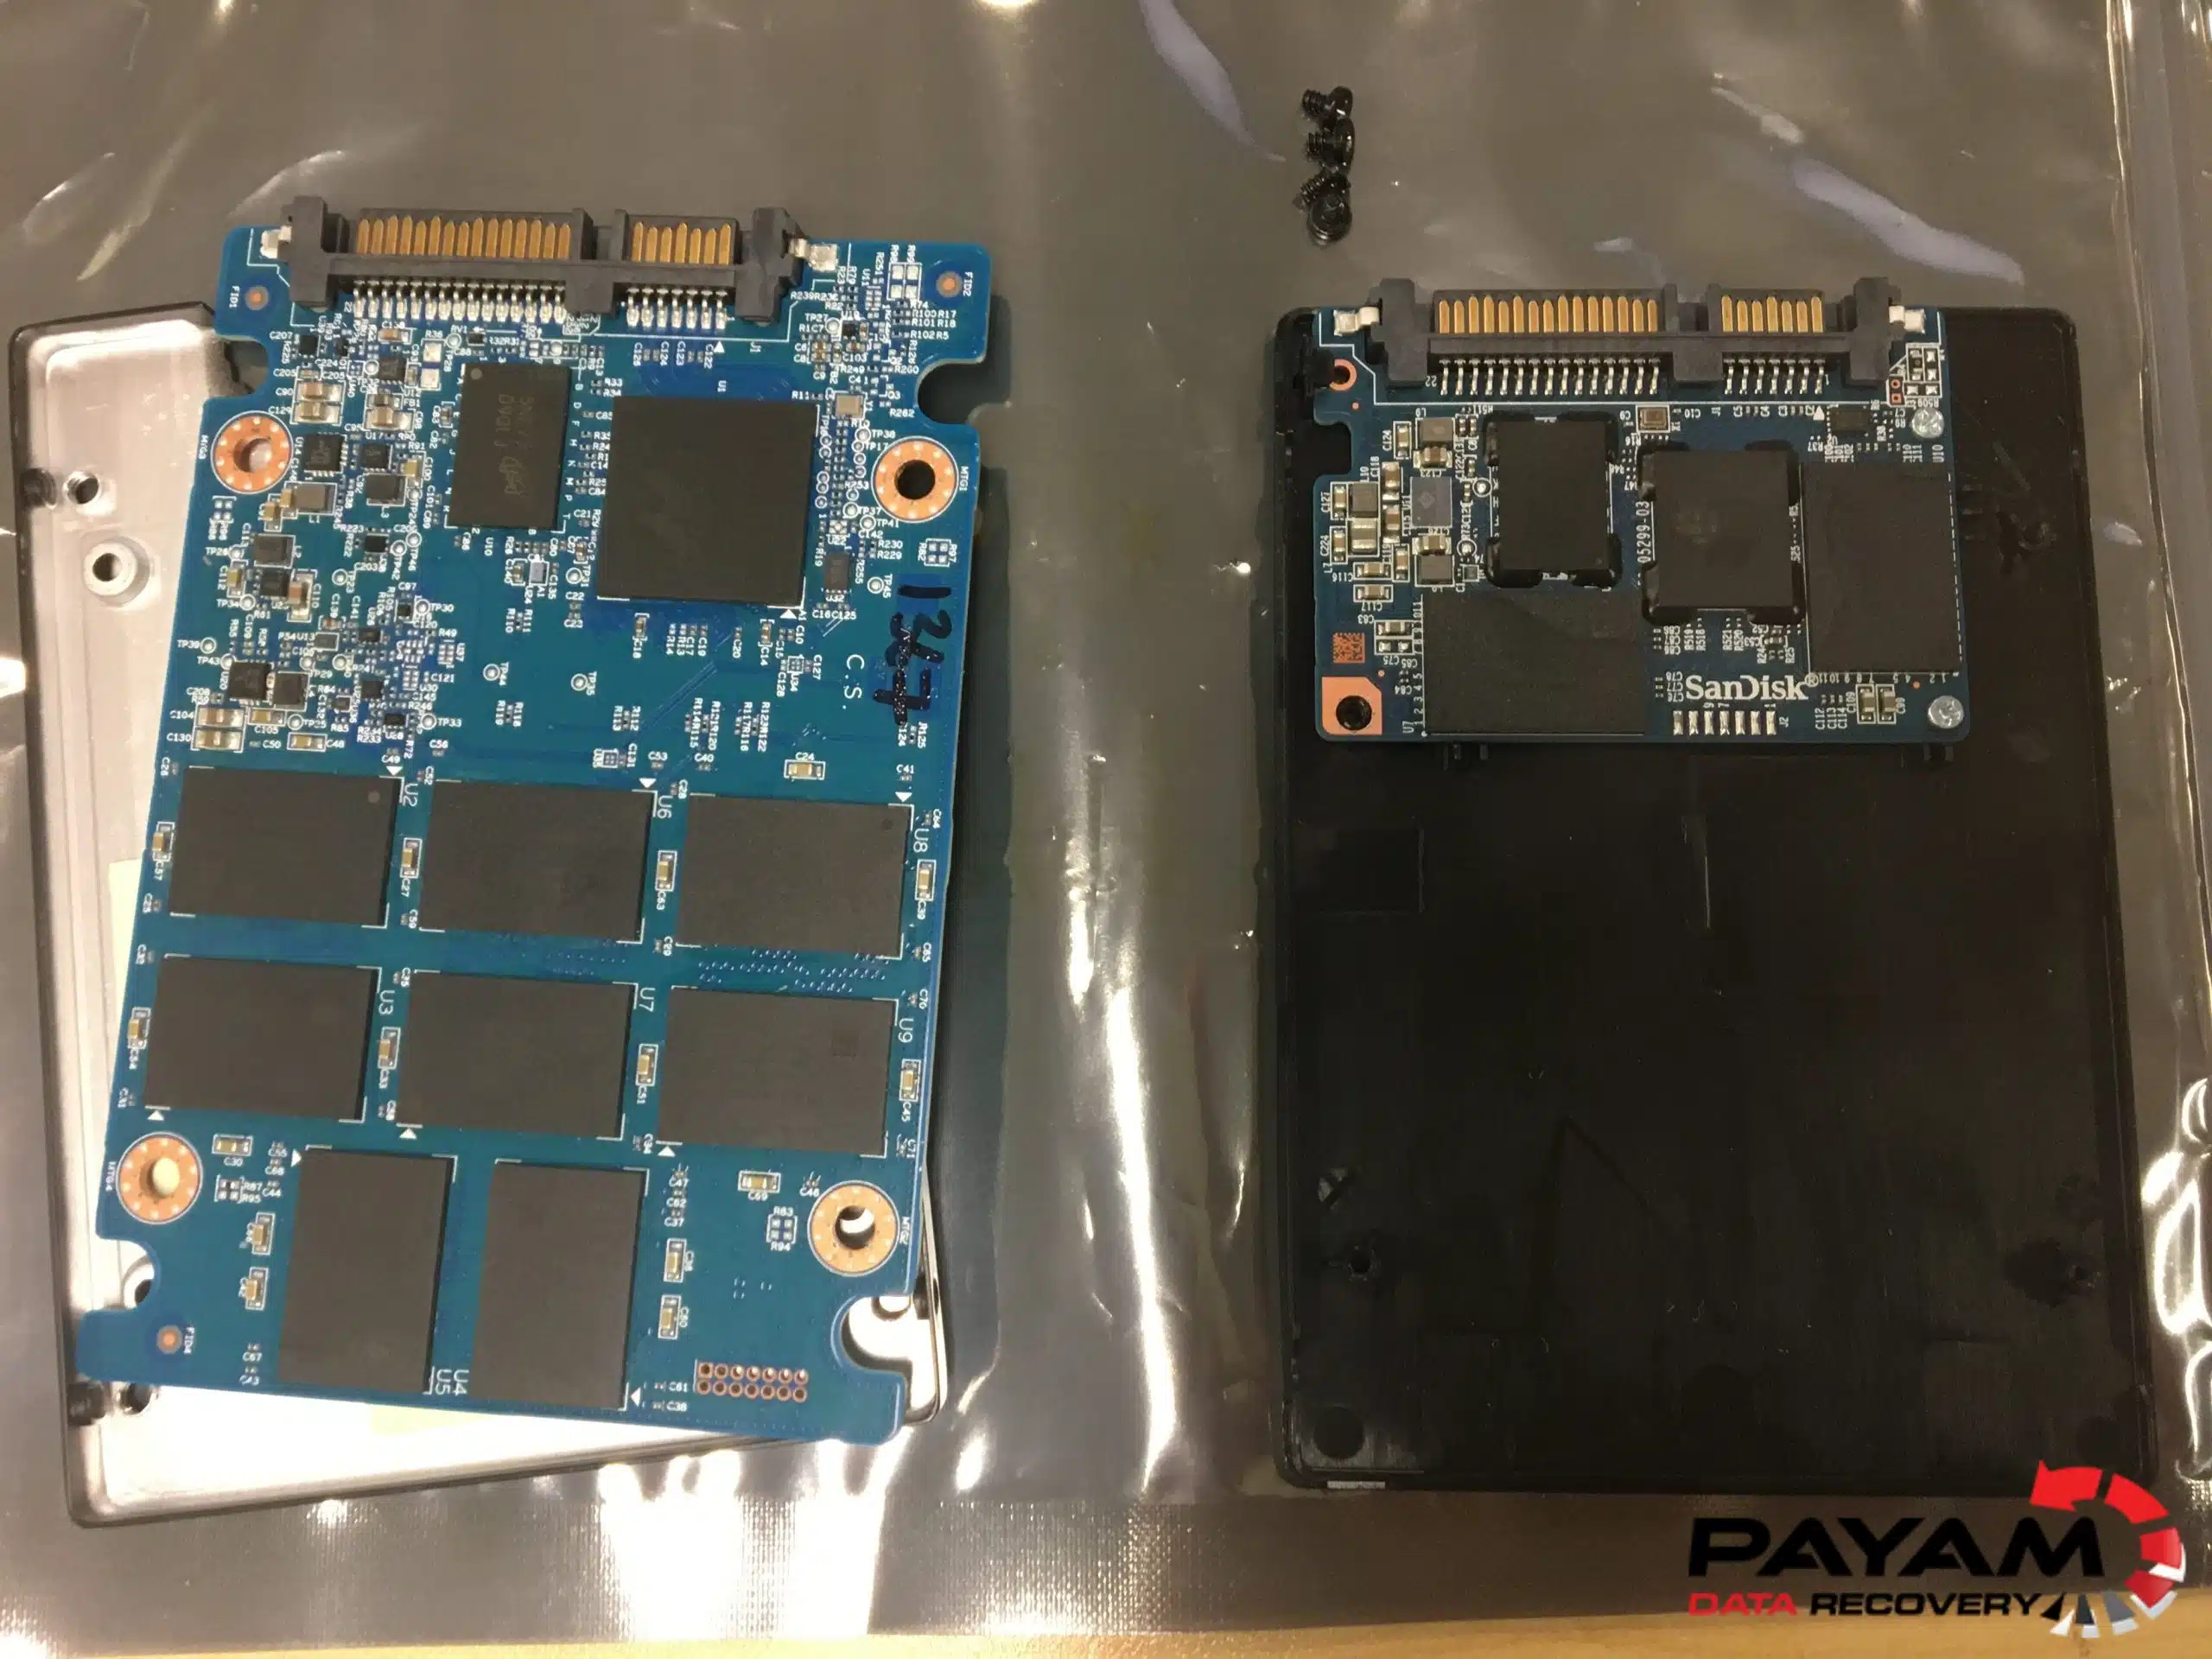
How does an SSD store information, why can two drives with similar labels perform differently, and what happens when files are deleted? This guide brings together 100 facts about solid-state storage, with links to manufacturers, standards organisations, researchers and historical collections. Product examples are dated, calculations are labelled, and published specifications are distinguished from independent test results.
A. What SSDs are and where they came from
1. An SSD stores data electronically.
It has no spinning recording platters or moving read/write heads.
Source: S01
2. Most modern SSDs use NAND flash.
NAND is non-volatile memory, meaning it can retain information without continuous power.
3. Early solid-state disk replacements were not necessarily flash drives.
Some used RAM with battery and disk backup arrangements to preserve data.
Source: S02
4. StorageTek introduced the STC 4305 in 1978.
The Computer History Museum describes this 45 MB RAM-based disk replacement, backed by batteries and hard disk drives.
Source: S02
5. Flash memory was publicly announced in 1984.
Kioxia’s chronology records this milestone separately from the later invention of NAND flash.
Source: S03
6. NAND flash was invented in 1987.
This is a memory-technology milestone, not evidence that a modern commercial NAND SSD launched that year.
Source: S03
7. Kioxia dates commercial 4 Mbit NAND flash to 1991.
A memory chip’s capacity is distinct from a complete drive’s capacity.
Source: S03
8. A flash-based SSD module prototype was built for IBM in 1991.
The museum credits SunDisk (now SanDisk) and highlights a controller that detects and corrects defective memory cells.
Source: S02
9. Fujio Masuoka was awarded the 2018 Honda Prize for his flash-memory work.
The award foundation’s announcement of 28 September 2018 is a primary historical reference.
Source: S04
10. Intel stopped future Optane development after its Q2 2022 announcement.
Intel’s notice (last reviewed 19 March 2025) says it planned to cease future development of Optane products while supporting existing customers. Optane should not be presented as a current NAND growth roadmap.
Source: S05
B. How NAND stores information
11. SLC stores one bit per cell, using two threshold-voltage states.
In single-level cell (SLC) NAND, the cell’s voltage range is divided into two windows, so reading it needs only one reference voltage.
Source: S10
12. MLC NAND stores two bits per cell in four states.
Cai and colleagues use multi-level cell (MLC) for a 2-bit cell with four possible states. Reading both bits of an MLC cell can need more than one reference voltage.
Source: S10
13. TLC stores three bits per cell in eight states.
Triple-level cell (TLC) flash divides the cell’s voltage range further, into eight windows that represent a 3-bit value.
Source: S10
14. QLC stores four bits per cell.
It does not mean four physical layers. SK hynix’s August 2025 release on its 321-layer QLC NAND groups NAND into SLC, MLC, TLC, QLC and penta-level cell (PLC) by how many bits one cell stores.
15. Each extra bit per cell doubles the number of states the cell must hold.
That gives 2, 4 and 8 states for one, two and three bits, and 24 = 16 for four bits. Cai and colleagues note that storing more bits per cell raises capacity without a larger chip, but makes it harder to store and read the bits correctly. See Diagram 4.
Calculation Source: S10
16. Flash cells can use different charge-storage structures.
Floating-gate and charge-trap designs both exist, so “floating gate” is not a universal description of NAND.
Source: S09
17. 3D NAND stacks layers of flash cells vertically.
Cai and colleagues explain that manufacturers turned to vertical stacking to raise density because shrinking the manufacturing process was becoming harder. Layer count and bits per cell describe different aspects of a memory design.
Source: S10
18. NAND programming and erasing use different units.
Data is programmed in pages, while an erase operation affects a larger block.
Source: S10
19. An SSD translates logical addresses into physical flash locations.
Its flash translation layer (FTL) allows physical placement to change without changing the address the host uses. See Diagram 1.
Source: S10
20. Physical flash capacity can exceed host-visible capacity.
Some capacity is spare area that supports internal management.
Source: S08
C. What the controller does
21. Wear levelling distributes erase activity.
It reduces uneven wear. It does not make every cell wear identically.
Source: S10
22. Error-correcting codes help recover data affected by bit errors.
Their correction capability is finite: once raw errors exceed what the code can correct, data is lost.
Source: S10
23. Bad-block management keeps unusable flash blocks out of normal service.
It does not guarantee recovery of information already lost.
Source: S10
24. TRIM tells an SSD that specified logical blocks are no longer needed.
It is a host-to-device notification (NVMe calls it deallocate), not a universal instant physical erasure. See Diagram 2.
25. Garbage collection reclaims flash space.
The controller can relocate valid data before erasing blocks for reuse.
26. Deletion and physical erasure are separate events.
Their timing, and the effect on recoverability, depend on the storage stack and the device’s behaviour. There is no fixed recovery window.
27. Over-provisioning supplies spare working space.
SNIA describes it as spare NAND used for garbage collection, wear levelling and background operations. It can affect endurance and performance.
Source: S08
28. Write amplification is NAND bytes written divided by host bytes written.
Internal management can increase this ratio. For example, 150 GB written to NAND for 100 GB of host writes is a write amplification factor (WAF) of 1.5 (hypothetical figures).
Calculation Source: S08
29. Some DRAM-less NVMe SSDs use Host Memory Buffer.
For example, Micron’s 2550 uses host memory for internal SSD functions.
Source: S11
30. An SLC cache need not be a separate SLC chip.
Some SSDs operate part of their higher-density (for example TLC) NAND in a one-bit mode as a write cache.
Source: S12
D. Formats, connectors and interfaces
31. M.2 describes a physical form factor.
The name alone does not establish whether a device uses SATA or PCIe/NVMe. See Diagram 3.
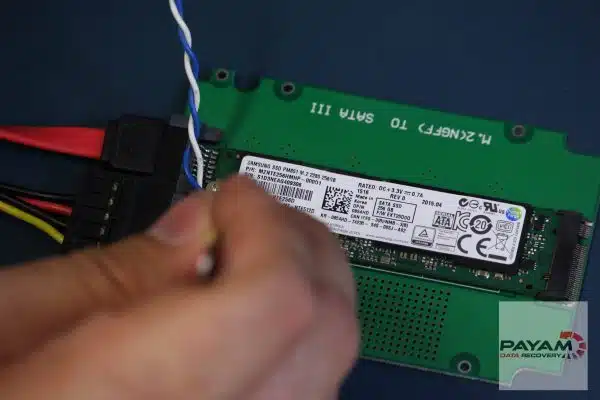
32. SNIA lists the 22 mm x 80 mm M.2 size at 22.15 x 80.15 x 2.23 mm.
Those are SNIA’s width, length and height figures for that size, which its table describes as an x4 PCIe module running the NVMe command set. Samsung lists the 9100 PRO’s form factor as M.2 (2280). SNIA also notes keying notches on the M.2 edge connector that designate interface or PCIe lane configurations.
33. The NVMe specification defines a register interface and command set for storage attached over PCI Express.
NVM Express describes NVMe as widely considered the de facto industry standard for PCIe SSDs. NVMe describes the commands; PCIe is the link that carries them.
Source: S45
34. A 2.5-inch enclosure does not identify the interface.
SNIA lists 2.5-inch SSDs (including enterprise U.2) as using PCIe/NVMe, SAS or SATA, so physical shape alone is insufficient.
Source: S14
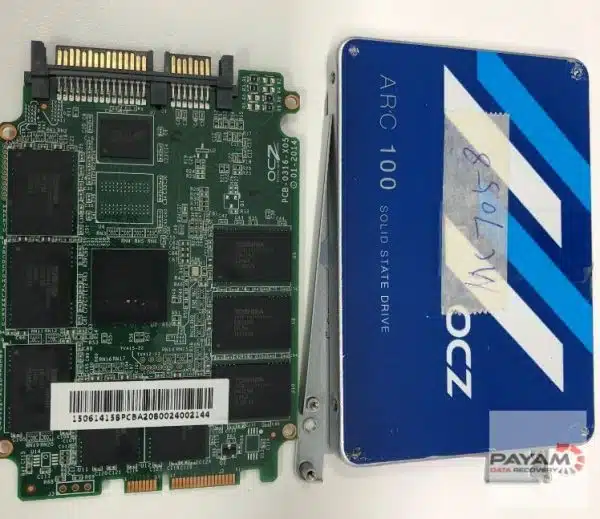
35. EDSFF is a family of enterprise and data-centre form factors.
Examples include E1.S, E1.L and E3 variants.
Source: S14
36. NVMe-MI is a separate specification for out-of-band management.
NVM Express describes the NVMe Management Interface as the command set and architecture for managing NVMe storage out of band, for example discovering, monitoring and updating NVMe devices through a server’s baseboard management controller (BMC).
Source: S45
37. NVM Express also publishes a boot specification.
The NVMe Boot Specification outlines a standard process for booting over the NVM Express interface. It defines how a pre-OS environment such as BIOS shares NVMe transport configuration with the operating system.
Source: S45
38. NVMe command sets and transports are specified separately.
NVM Express says separate command set specifications let it evolve features such as Zoned Namespaces and Key Value independently, and separate transport specifications do the same for memory and fabric transports.
Source: S45
39. USB-C identifies a connector system.
It does not, by itself, specify a transfer speed or guarantee USB4 support.
Source: S15
40. A USB-C cable can support only USB 2.0 data speeds.
USB-IF describes USB 2.0 Type-C cables that support USB 2.0 data only. Connector fit therefore does not prove that a cable can deliver an external SSD’s advertised performance.
Source: S15
E. Understanding performance
41. IOPS means input/output operations per second.
It counts operations, not bytes.
Source: S01
42. Throughput measures data transferred per unit of time.
SNIA defines it as block size multiplied by IOPS, commonly reported in MB/s or GB/s.
Source: S01
43. Latency measures the time taken to service a request.
It answers a different question from throughput.
Source: S01
44. Queue depth is the number of outstanding commands.
A performance result without its workload conditions is difficult to compare fairly.
Source: S01
45. Request size and access pattern affect performance.
A large sequential transfer and small random requests are different tests.
Source: S16
46. Sustained writes can slow after an SLC cache fills.
A short benchmark may miss this change.
Source: S12
47. An NVMe SSD can tell the host when it is over its temperature threshold or throttling.
NVM Express describes the drive reporting that it is exceeding its temperature threshold and/or throttling, and says the drive can also send the host an asynchronous event when this happens. A speed test on a hot drive may therefore not match one on a cool drive.
Source: S29
48. Capacity affects specifications within some SSD families.
Samsung’s 9100 PRO table lists 14,700 MB/s sequential read for the 1 TB and 2 TB models and 14,800 MB/s for the 4 TB and 8 TB models.
Manufacturer rating Source: S20
49. The test computer matters.
Samsung says its performance varies with firmware, system hardware and configuration, and that its write figures were measured with Intelligent TurboWrite active.
Source: S20
50. Repeatable SSD testing requires defined preparation and workload.
SNIA publishes a Solid State Storage Performance Test Specification (version 2.0.1, 2018) for this purpose.
Source: S16
F. Documented modern milestones
As of October 2026. Manufacturer announcements, not independent tests.
51. Micron announced on 5 May 2026 that its 245 TB 6600 ION SSD was shipping.
It is an enterprise product (U.2 and E3.L), not an ordinary laptop upgrade. Micron’s headline says 245 TB; its footnote uses 245.76 TB for rack calculations.
Manufacturer rating Source: S17
52. Kioxia announced a 245.76 TB LC9 SSD in July 2025.
That announcement described sampling to select customers, which is not the same as general retail availability.
Source: S18
53. Solidigm lists capacities up to 122.88 TB for its D5-P5336 enterprise SSD.
This remains a useful named example, without labelling it the world’s largest SSD.
Source: S19
54. Samsung announced Australian availability of an 8 TB 9100 PRO on 30 September 2025.
It is a consumer PCIe 5.0 x4 NVMe M.2 SSD, a different class from high-capacity enterprise SSDs.
Source: S20
55. Samsung specifies up to 14,800 MB/s sequential reads for the 8 TB 9100 PRO.
This is a manufacturer rating under stated conditions; the same table lists up to 13,400 MB/s sequential writes with Intelligent TurboWrite active.
Manufacturer rating Source: S20
56. Micron lists up to 28 GB/s sequential reads for its PCIe Gen6 9650 enterprise SSD.
A product rating is not a guarantee for every workload. Samsung announced mass production of its PM1763 PCIe 6.0 SSD on 8 July 2026, rating the 16 TB model at up to 28,400 MB/s reads.
57. Micron also lists up to 5.5 million random-read IOPS for the 9650.
IOPS and sequential bandwidth are separate specifications.
Manufacturer rating Source: S21
58. SK hynix announced mass production of 321-layer TLC NAND in November 2024.
This describes memory manufacturing (a 1 Tb device), not the specification of every SSD using that manufacturer’s brand.
Source: S22
59. Kioxia announced 332-layer TLC NAND samples on 3 July 2026.
The announcement concerned tenth-generation 1 Tb memory devices sent for functional checks, whose specifications may differ in mass production. It is not a finished SSD.
Source: S24
60. Kioxia and Sandisk’s tenth-generation QLC announcement describes bonding separately fabricated CMOS and memory-array wafers.
This was a design in development on 4 August 2026, and a manufacturing innovation, not just a larger layer number.
Source: S25
G. Endurance and reliability
61. TBW means terabytes written.
It expresses a rated write workload under defined conditions.
Source: S08
62. DWPD means drive writes per day.
It relates write workload to capacity and a specified period: DWPD = TBW / 365 / warranty years / capacity.
Source: S08
63. TBW is not an exact failure counter.
Warranty limits and actual failure dates are different concepts. Samsung’s 8 TB 9100 PRO warranty is “five years or TBW, whichever comes first”.
64. MTBF describes population reliability.
Converting its hours into years does not reveal how long an individual drive will last.
Source: S23
65. Failure-rate comparisons need matching context.
Drive age, workload, environment, observation period and the definition of failure all affect interpretation.
66. A major 2016 field study examined flash reliability across six years and ten drive models.
It used Google data-centre drives. Its findings describe that population, not every SSD sold today.
Source: S28
67. NVMe health logs expose useful indicators.
These include a critical warning and a “percentage used” endurance gauge. A health report should not be treated as a promise against failure.
Source: S29
68. Power-loss protection can be specific to one model.
For example, Micron says its 7450 family includes a PCIe Gen4 M.2 22x80mm model with power-loss protection, designed specifically for server boot use. Check the datasheet for the exact model rather than assuming every SSD has it.
Source: S46
69. NVMe SMART data counts unsafe shutdowns.
NVM Express notes that the SMART log lists the number of unsafe shutdowns, which can be caused by power-loss events, along with power-on hours. The count records that such events happened; it is not a list of affected files.
Source: S29
70. Flash retention depends on conditions, including temperature and wear.
Non-volatile does not mean permanent archival storage.
H. Capacity, power and engineering trade-offs
71. One byte contains eight bits.
A lowercase “b” and an uppercase “B” therefore matter in storage specifications.
Source: S31
72. A decimal terabyte and a binary tebibyte differ.
1 TB is 1012 bytes; 1 TiB is 240 bytes.
Source: S31
73. A decimal 1 TB equals approximately 931.32 GiB.
Calculation: 1,000,000,000,000 / 1,073,741,824. This is unit conversion before allowing for partitions, file-system metadata or reserved space. See the worked example below.
Calculation Source: S31
74. A bit-rate figure cannot be read as the same number of bytes per second.
Divide by eight for the raw unit conversion; protocol overhead is a separate issue.
Calculation Source: S31
75. Layer count and cell type can change independently.
SK hynix announced 321-layer QLC production in August 2025, following its 321-layer TLC announcement.
76. A NAND-chip interface rate is not an SSD’s host transfer rate.
Kioxia’s 332-layer sample announcement specifies a 4.8 Gbit/s NAND interface.
Source: S24
77. Active and sleep power are different specifications.
Samsung lists 10.5 W (read) and 8.8 W (write) active power for the 8 TB 9100 PRO, and 9.3 mW and 8.6 mW in device sleep (L1.2). No single wattage represents an SSD.
Manufacturer rating Source: S20
78. Large enterprise SSDs can exceed common laptop-SSD power assumptions.
Micron’s 245 TB 6600 ION announcement gives up to 30 W at maximum power.
Manufacturer rating Source: S17
79. Some data-centre SSDs are designed for liquid cooling.
Micron offers its 9650 in E1.S with a liquid cooling option, and Samsung says its PM1763 is optimised for direct-to-chip (D2C) liquid cooling in servers. On the consumer side, Samsung sells the 9100 PRO with or without a heatsink and says the heatsink version adds a layer of thermal control.
80. Operating temperature and unpowered retention are different specifications.
SNIA’s table lists separate temperatures for active use and for power-off retention.
Source: S08
I. Recovery, encryption and erasure
81. Professional recovery support can depend on controller and firmware.
ACE Lab says support depends on the combination of firmware and controller, so a brand name alone is insufficient to establish tool compatibility.
Source: S33
82. Controller or firmware failure can prevent access to flash that still contains information.
ACE Lab’s 2015 description names problems with the main microprogram or translators as typical. Recoverability depends on more than whether the memory packages are physically intact.
Source: S34
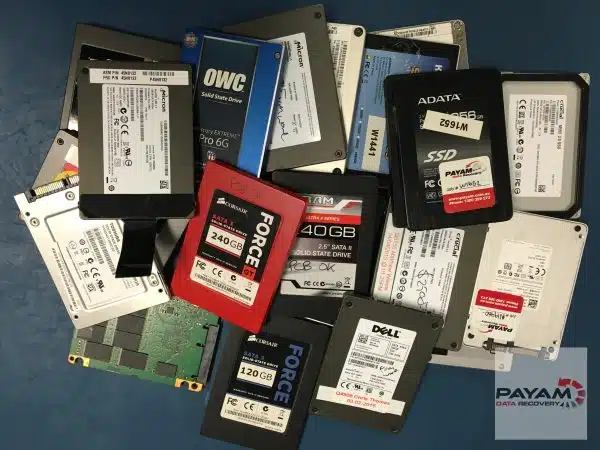
83. A published recovery method after formatting is not proof that all trimmed data is recoverable.
ACE Lab’s July 2026 walkthrough describes rebuilding a translator on one USB SSD (SM2320G controller), and states that results depend on the translation state, TRIM activity, elapsed time and controller behaviour.
Source: S30
84. Encryption can prevent a useful chip-level readout.
ACE Lab notes that reading chips directly can yield random-looking data, and that files encrypted with a key (its example is AES-128) cannot be recovered without it. Raw NAND contents are not the keys and metadata needed to interpret them.
Source: S34
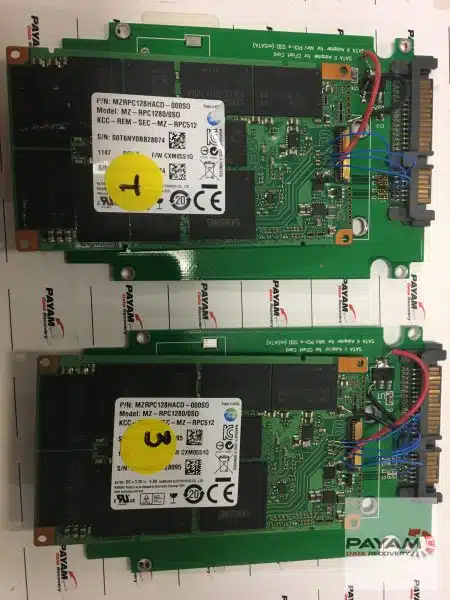
85. Apple silicon and T2 Macs use hardware-linked encryption for internal storage.
The encryption design can affect what a removed storage component reveals.
Source: S39
86. Turning FileVault off does not make those Macs’ internal storage unencrypted.
Apple says the volume stays encrypted, with its key protected only by the hardware UID.
Source: S39
87. A BitLocker recovery key is a 48-digit number.
Keeping the correct recovery information can be essential when Windows requests it.
Source: S40
88. Microsoft cannot recreate a lost BitLocker recovery key.
Account, printout and organisational recovery records may therefore be important.
Source: S40
89. Cryptographic erase works by sanitising the relevant encryption keys.
NIST says its effectiveness depends on the implementation and on strong cryptography and key management.
Source: S35
90. A factory reset is not automatically verified SSD sanitisation.
The appropriate method and its successful completion must be established.
Source: S35
J. Standards, calculations and data protection
91. The NVM Express specification index lists Base Specification 2.4, ratified on 31 July 2026.
Specification versions are separate from PCIe generations.
Source: S41
92. A newer standard does not retroactively add features to older devices.
For example, Samsung’s 9100 PRO specification lists NVMe 2.0 even though later specification revisions exist.
93. Sampling, mass production and product availability describe different milestones.
A memory sample announcement alone does not establish a finished SSD’s retail availability.
94. 100,000 operations of 4,096 bytes transfer 409.6 MB.
At 100,000 IOPS this corresponds to 409.6 MB/s of data, before considering other bottlenecks.
95. NIST published Revision 2 of its media-sanitisation guidance in September 2025.
Cite the current revision (SP 800-88 Rev. 2, which supersedes Rev. 1 of 2014) rather than treating the older revision as current.
Source: S35
96. Degaussing is not an appropriate way to sanitise NAND flash.
Its stored information is not magnetic recording. NIST notes a degaussing operation on an SSD can complete successfully while no sensitive data is sanitised.
Source: S35
97. Overwriting host-visible addresses may leave other physical flash areas untouched.
NIST says devices with spare cells and wear levelling cannot directly address all areas where data was stored, so SSD sanitisation must account for internal storage management.
Source: S35
98. Backups can protect against hardware failure as well as malware.
A working drive is not itself a backup of its only copy of a file.
Source: S36
99. Backups in different locations address different loss scenarios.
CISA recommends combining on-site and remote backups.
Source: S36
100. A hypothetical 2 TB drive rated for 600 TBW across five years averages about 0.164 DWPD.
Calculation: 600 / (2 x 365 x 5). It is a workload budget, not a prediction of the drive’s failure date.
Calculation Source: S08
Terms that are often confused
| Term | What it describes | Example | Facts |
|---|---|---|---|
| Form factor | Physical format | M.2, E1.S | 31, 32, 34, 35 |
| Interconnect | Communication link | PCIe | 33, 54, 56 |
| Protocol | Storage commands and communication rules | NVMe | 33, 36, 37, 38 |
| Cell type | Bits stored per NAND cell | TLC or QLC | 11, 12, 13, 14, 15 |
| Layer count | Vertical memory structure | A stated NAND generation’s layer count, such as 321 or 332 | 17, 58, 59, 75 |
| Endurance rating | Specified write workload | TBW or DWPD | 61, 62, 63, 100 |
Glossary
- NAND flash
- Non-volatile memory that stores bits in cells and keeps them without power. (facts 2, 17)
- Controller
- The chip in an SSD that manages flash: mapping, error correction, wear levelling and garbage collection. (facts 19, 21, 25)
- Firmware
- The software the controller runs. It implements functions such as the flash translation layer. (facts 19)
- Flash translation layer (FTL)
- The part of the controller that maps host logical addresses to physical flash locations. (facts 19)
- ECC (error-correcting code)
- Extra data that lets the controller correct a limited number of bit errors. (facts 22)
- Wear levelling
- Spreading erase and program activity across blocks to reduce uneven wear. (facts 21)
- Over-provisioning
- Spare flash capacity used for housekeeping, which can affect endurance and performance. (facts 20, 27)
- TRIM
- A host message that identifies logical blocks no longer needed. NVMe calls the equivalent deallocate. (facts 24)
- Garbage collection
- The SSD's internal reclaiming of space by moving valid data and erasing blocks. (facts 25)
- Write amplification (WAF)
- NAND bytes written divided by host bytes written. (facts 28)
- DWPD
- Drive writes per day: a rated workload relative to capacity over a stated period. (facts 62, 100)
- MTBF
- A population reliability statistic, not an individual drive's expected lifespan. (facts 64)
- Latency
- The time taken to service one request. (facts 43)
- Throughput (bandwidth)
- Data transferred per unit of time, such as MB/s or GB/s. (facts 42)
- Queue depth
- The number of outstanding commands. (facts 44)
- PCIe
- A high-speed interconnect that carries NVMe commands. A drive’s specification states the PCIe generation and number of lanes, such as PCIe 5.0 x4. (facts 33, 54, 56)
- NVMe
- A storage protocol designed for flash, commonly carried over PCIe. (facts 33)
- EDSFF
- A family of enterprise and data-centre SSD form factors such as E1.S and E3.S. (facts 35)
Classroom worksheet
For students aged about 14 and over, individually or in pairs. Use a calculator. All figures are hypothetical unless a fact number is given. No experiments are needed, and none should be done on real storage: do not deliberately cut power to a drive, test recovery on personal storage or flash firmware.
- States per cell. How many distinguishable states must a QLC cell hold? How many for TLC? Hypothetically, how many would a cell storing five bits need? (Facts 13 to 15, Diagram 4.)
- Capacity. A 2 TB (decimal) drive is reported by an operating system in GiB. How many GiB is that? (Fact 73, worked example.)
- Reading time. Samsung rates the 8 TB 9100 PRO at up to 14,800 MB/s sequential read. At exactly that rate, how many minutes would it take to read 8 TB (decimal) once? Why would copying 8 TB of real files usually take longer? (Facts 47, 54, 55.)
- Write amplification. An SSD writes 150 GB to NAND while the host writes 100 GB. What is the WAF? (Fact 28.)
- Endurance budget. A hypothetical 2 TB SSD has a 1,200 TBW rating and a five-year warranty. Calculate DWPD. Is that a prediction of when the drive will fail? (Facts 62, 63, 100.)
- IOPS to throughput. A drive does 250,000 IOPS with 4,096-byte requests. What throughput is that in MB/s (decimal)? (Facts 42, 94.)
- Read the announcement. Classify each phrase as “shipping”, “sampling”, “samples for functional check” or “in development”, and say what you could and could not conclude about buying the product: (a) “is now shipping” (b) “now sampling to select customers” (c) “for the functional check purpose” (d) “in development”. (Facts 51, 52, 59, 60, 93.)
- Two common misreadings. (a) Why does a USB-C port not tell you the speed? (b) Why is “MTBF of 2 million hours” not “this drive lasts 228 years”? (Facts 39, 40, 64.)
- Benchmark reading exercise. A review says “Drive A is faster than Drive B”. Using the blank template below, list which missing details would prevent a fair comparison. Do not invent results. (Facts 44 to 50; testing methodology: SNIA PTS, S16.)
| Field | Drive A | Drive B |
|---|---|---|
| Model | ||
| Capacity | ||
| Firmware version | ||
| Host connection (PCIe generation and lanes) | ||
| Read/write mix | ||
| Request size | ||
| Queue depth | ||
| Cache state (SLC cache full or empty) | ||
| Drive utilisation (how full) | ||
| Temperature | ||
| Test duration |
Answer key
- QLC: 24 = 16 states. TLC: 23 = 8. Five bits: 25 = 32 states (hypothetical). Each extra bit doubles the states.
- 2 × 931.32 ≈ 1,862.65 GiB (2,000,000,000,000 ÷ 1,073,741,824). This is unit conversion only; formatting reduces usable space further.
- 8,000,000 MB ÷ 14,800 MB/s ≈ 540.5 seconds ≈ 9.0 minutes. The figure is a manufacturer rating for sequential reads; the destination drive, the host connection, file sizes, the file system and temperature (throttling) all limit real copies.
- 150 ÷ 100 = 1.5.
- DWPD = 1,200 ÷ (2 × 365 × 5) = 1,200 ÷ 3,650 ≈ 0.329. No: it is a rated workload budget, and failure can occur before or after reaching it.
- 250,000 × 4,096 = 1,024,000,000 bytes per second = 1,024 MB/s (decimal), before other bottlenecks.
- (a) Shipping: a product is being shipped, though an enterprise model may still not be a retail product. (b) Sampling to select customers: not general availability. (c) Samples for functional check: the memory specification may differ in mass production, and a memory chip is not a finished SSD. (d) In development: no product availability can be concluded.
- (a) USB-C names a connector; the speed depends on the host port, the device and the cable, and a cable may support USB 2.0 data only. (b) MTBF is a population statistic under stated conditions, so dividing hours by 8,760 does not give one drive’s life (2,000,000 ÷ 8,760 ≈ 228 years is an arithmetic result, not a prediction).
- Look for: model, capacity, firmware, host connection, read/write mix, request size, queue depth, cache state, how full the drive was, temperature and test duration. Without them the two results are not comparable.
Sources
Each fact above links to the source that supports it. Manufacturer ratings are labelled as such and are not independent measurements. Sources were accessed on 23 October 2026. Product facts will change, so check the linked source for the current position.
- S01 SNIA, What is an SSD? (facts 1, 2, 41, 42, 43, 44, 94)
- S02 Computer History Museum, Solid state drive module demonstrated (facts 3, 4, 8)
- S03 Kioxia, History of technology (facts 5, 6, 7)
- S04 Honda Foundation, Honda Prize 2018 announcement (28 Sep 2018) (facts 9)
- S05 Intel, Product discontinuation notice for Intel Optane memory (facts 10)
- S06 Kingston, NAND flash technology and SSDs (facts 2)
- S07 Kingston, SSD garbage collection and TRIM explained (facts 24, 25, 26)
- S08 SNIA, Endurance of NVMe, SAS, and SATA SSDs (white paper) (facts 20, 24, 27, 28, 61, 62, 63, 70, 80, 100)
- S09 Kioxia, Twin BiCS FLASH announcement (12 Dec 2019) (facts 16)
- S10 Cai et al., Error Characterization, Mitigation, and Recovery in Flash-Memory-Based SSDs (facts 11, 12, 13, 14, 15, 17, 18, 19, 21, 22, 23, 25, 70)
- S11 Micron, 2550 client SSD (facts 29)
- S12 Yang, Cong and Gao, In-place Switch: Reprogramming based SLC Cache Design (2024) (facts 30, 46)
- S14 SNIA, SSD Form Factors (facts 31, 32, 34, 35)
- S15 USB-IF, USB Type-C language and packaging guidelines (20 Mar 2023) (facts 39, 40)
- S16 SNIA, Solid State Storage Performance Test Specification 2.0.1 (2018) (facts 45, 50)
- S17 Micron, 245 TB 6600 ION now shipping (5 May 2026) (facts 51, 78)
- S18 Kioxia, LC9 245.76 TB announcement (22 Jul 2025) (facts 52, 93)
- S19 Solidigm, D5-P5336 product page (facts 53)
- S20 Samsung Australia, 9100 PRO 8 TB announcement (30 Sep 2025) (facts 32, 48, 49, 54, 55, 63, 77, 79, 92)
- S21 Micron, 9650 data-centre SSD (facts 56, 57, 79)
- S22 SK hynix, 321-layer TLC mass production (21 Nov 2024) (facts 58, 75, 93)
- S23 Seagate, Reliability and MTBF/AFR (facts 64, 65)
- S24 Kioxia, 10th-generation 332-layer BiCS FLASH samples (3 Jul 2026) (facts 59, 76, 93)
- S25 Kioxia and Sandisk, 10th-generation QLC (4 Aug 2026) (facts 60)
- S28 Schroeder, Lagisetty and Merchant, Flash Reliability in Production (USENIX FAST 2016) (facts 65, 66)
- S29 NVM Express, Error reporting, SMART log pages and management (facts 47, 67, 69)
- S30 ACE Lab, Beyond TRIM: formatted Transcend USB SSD, SM2320G, part 3 (2 Jul 2026) (facts 26, 83)
- S31 NIST, Prefixes for binary multiples (facts 71, 72, 73, 74, 94)
- S32 SK hynix, 321-layer QLC mass production (Aug 2025) (facts 14, 75)
- S33 ACE Lab, PC-3000 SSD supported-drive list (facts 81)
- S34 ACE Lab, PC-3000 SSD Active Utilities: main concept (2015) (facts 82, 84)
- S35 NIST SP 800-88 Rev. 2, Guidelines for Media Sanitization (Sep 2025) (facts 89, 90, 95, 96, 97)
- S36 CISA, Back Up Government Data (facts 98, 99)
- S38 Kingston, What is NVMe SSD technology? (facts 31)
- S39 Apple Platform Security, Internal storage encryption (facts 85, 86)
- S40 Microsoft, Find your BitLocker recovery key (facts 87, 88)
- S41 NVM Express, Base Specification index (facts 91, 92)
- S43 Samsung Semiconductor, PM1763 mass production (8 Jul 2026) (facts 56, 79)
- S45 NVM Express, About (open standards and specification family) (facts 33, 36, 37, 38)
- S46 Micron, 7450 data-centre SSD (facts 68)


