Hard Drive Failure Statistics 2025: Insights from 30,000+ Drives
Hard drive failures can shatter lives, wiping out precious family photos, critical business records, or years of academic work. At Payam Data Recovery, Australia’s oldest and largest data recovery service, we’ve studied over 30,000 hard drives from 2020 to 2025 to uncover trends in Hard Drive Failure Statistics.
This article blends real-world data with technical insights to explain why some drives fail more often and how you can protect your data. Our aim is to provide a resource that’s both educational and shareable, helping you make informed choices based on Hard Drive Failure Statistics.
Table of Contents
- Why Hard Drive Failures Hurt
- Our Hard Drive Failure Statistics: 30,000+ Drives Analysed
- Common Failure Types
- Hard Drive Failure Statistics: Recovery Success Rates
- Hard Drive Failure Statistics: Models with Higher Failure Rates
- Why Some Drives Fail More
- Entry Level vs. Enterprise Drives: A Technical Comparison
- Expert Advice from Payam Toloo
- How to Safeguard Your Data: Lessons from Hard Drive Failure Statistics
- Glossary of Terms
Why Hard Drive Failures Hurt
Losing a hard drive isn’t just about broken hardware: it’s about losing memories and livelihoods. We’ve seen parents heartbroken over vanished family photos, business owners scrambling to recover client data, and students devastated by lost projects. By sharing Hard Drive Failure Statistics and practical tips, we hope to help you avoid these painful scenarios to safeguard your data.
Our Hard Drive Failure Statistics: 30,000+ Drives Analysed
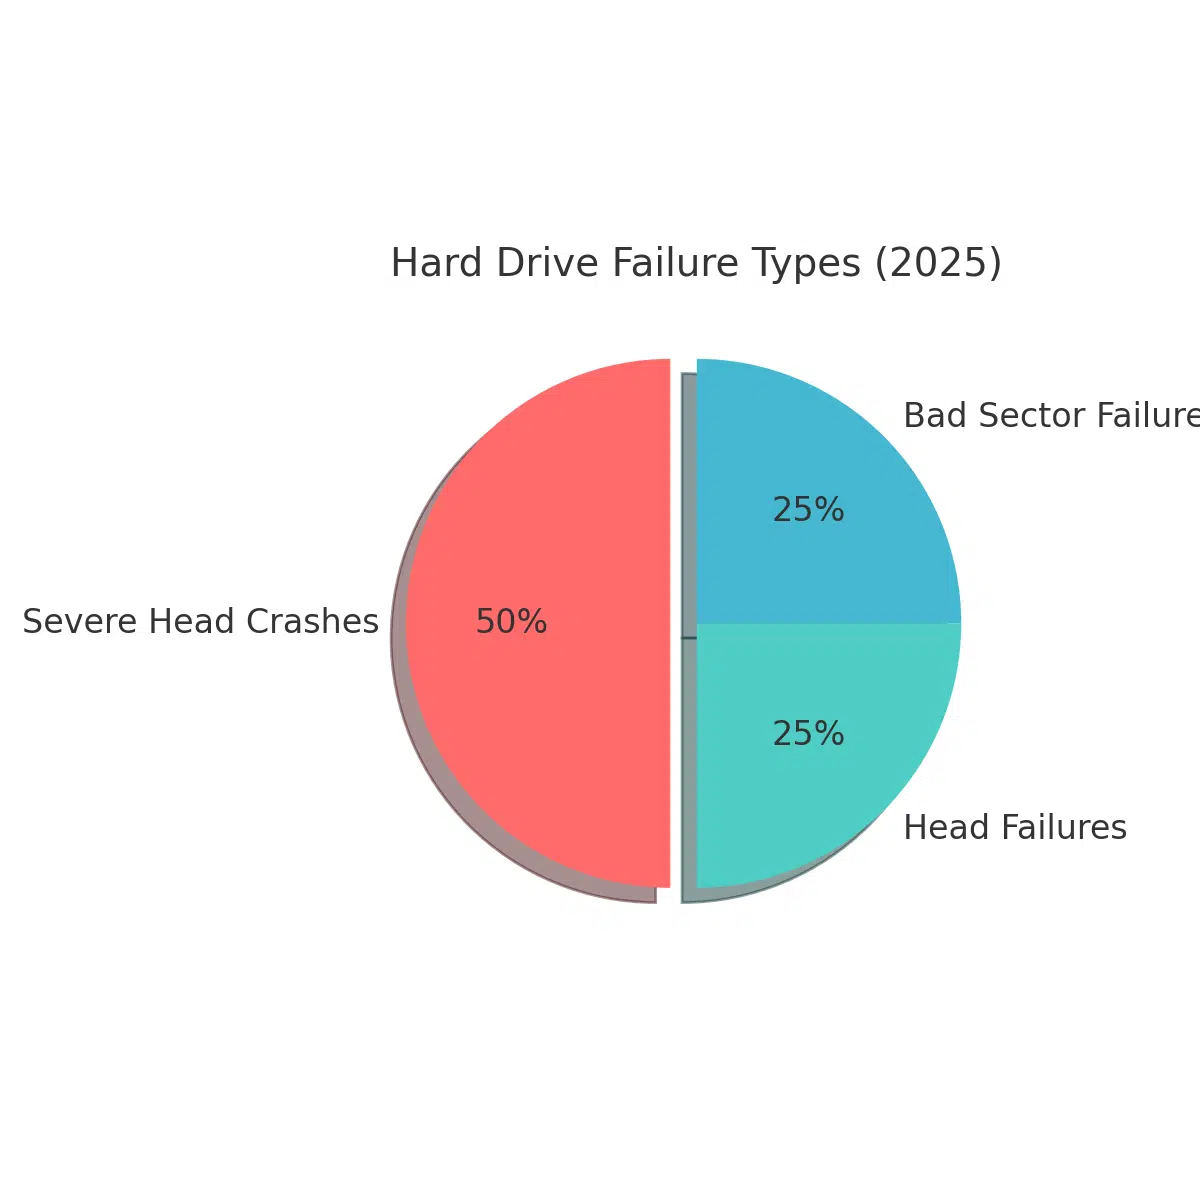
From 2020 to 2025, Payam Data Recovery processed around 30,000 hard drives across Australia, submitted by everyday users. Our Hard Drive Failure Statistics identified three main failure types:
- Severe Head Crashes: Total data loss from platter damage, often due to drops.
- Head Failures: Damaged heads, recoverable with expertise (99%+ success rate).
- Bad Sector Failures: Worn sectors causing slowdowns, fully recoverable if caught early.
These trends in Hard Drive Failure Statistics may reflect the popularity of affordable, entry-level models, which are widely used due to their low cost.
Common Failure Types
Let’s explore how hard drives fail, according to our Hard Drive Failure Statistics:
- Severe Head Crashes: A drop or jolt causes the read/write heads to scrape the platters, destroying data permanently.
- Head Failures: Damaged heads signal fragility but allow near-complete recovery with professional tools.
- Bad Sector Failures: Too many bad sectors slow or freeze your system, indicating the drive is nearing its end. Symptoms include slow folder loading, files appearing empty, or the drive seeming busy when idle.
For a deeper dive into why hard drives fail, watch this insightful video by Linus Tech Tips:
Credit: “Why Do Hard Drives Fail?” by Linus Tech Tips
Hard Drive Failure Statistics: Recovery Success Rates
Understanding the likelihood of data recovery is crucial when dealing with hard drive failures. Based on our Hard Drive Failure Statistics, here are the recovery success rates for each failure type identified in our analysis of over 30,000 drives:
- Severe Head Crashes: 0% success rate due to permanent platter damage, making data unrecoverable.
- Head Failures: 99%+ success rate, as damaged heads can often be replaced in a cleanroom environment.
- Bad Sector Failures: 100% success rate if addressed early, as data can be retrieved before further degradation.
These HDD failure data points highlight the importance of professional intervention and timely action to maximize recovery chances.
Hard Drive Failure Statistics: Models with Higher Failure Rates
Our Hard Drive Failure Statistics highlight models, often entry-level, that show higher failure rates, likely due to their widespread use and cost-driven designs. Below are examples from our findings, noting that popularity and affordability may contribute to these statistics.
Severe Head Crashes (Total Data Loss)
These failures result in unrecoverable data, as per our Hard Drive Failure Statistics:
| Rank | Brand & Model | Capacity | Interface | Notes |
|---|---|---|---|---|
| 1 | Seagate ST2000LM007 | 2TB | SATA 6 Gbs | Common in external drives. |
| 2 | Western Digital WD20SDRW | 2TB | SATA 6 Gbs, USB 3.0 | Popular in portable WD models. |
| 3 | Seagate ST3000DM001 | 3TB | SATA 6 Gbs | Desktop drive; needs careful handling. |
| 4 | Western Digital WD40NDZW | 4TB | SATA 6 Gbs, USB 3.0 | Higher risk in mobile use. |
| 5 | Seagate ST1000LM035 | 1TB/2TB | SATA 6 Gbs | Used in laptops and externals. |
Note: The Seagate ST3000DM001 has been noted for higher failure rates in older models, as reported in the “Backblaze Drive Stats for 2024”, though newer versions have improved.
Head Failures (99%+ Recovery)
These drives are fragile but recoverable, according to our Hard Drive Failure Statistics:
| Rank | Brand & Model | Capacity | Interface | Notes |
|---|---|---|---|---|
| 1 | Seagate ST2000LM007 | 2TB | SATA 6 Gbs | Frequent but recoverable. |
| 2 | Western Digital WD20SDRW | 2TB | SATA 6 Gbs, USB 3.0 | Needs careful handling. |
| 3 | Seagate ST1000LM035 | 1TB/2TB | SATA 6 Gbs | Common in laptops. |
| 4 | Western Digital WD10JMVW | 1TB | SATA 6 Gbs, USB 3.0 | Prone to head issues. |
| 5 | Seagate ST3000DM001 | 3TB | SATA 6 Gbs | Desktop; recoverable with care. |
Bad Sector Failures (100% Recovery)
These are recoverable but signal wear, as seen in our Hard Drive Failure Statistics:
| Rank | Brand & Model | Capacity | Interface | Notes |
|---|---|---|---|---|
| 1 | Western Digital WD20SDRW | 2TB | SATA 6 Gbs, USB 3.0 | Common in portables. |
| 2 | Seagate ST2000LM007 | 2TB | SATA 6 Gbs | Shows wear over time. |
| 3 | Toshiba MQ04UBD200 | 2TB | SATA 6 Gbs, USB 3.0 | Seen in external drives. |
| 4 | Seagate ST1000LM035 | 1TB/2TB | SATA 6 Gbs | Frequent but recoverable. |
| 5 | Toshiba MQ04UBF100 | 1TB | SATA 6 Gbs, USB 3.0 | Found in Toshiba externals. |
Note:
You may notice some drive models, like the Seagate ST2000LM007 or WD20SDRW, appear in all three failure categories. That is not a mistake. The same model can fail in different ways. Some develop bad sectors from wear and tear, others suffer from head failures, and in more serious cases, a head failure can lead to a crash that physically damages the platters and makes recovery impossible. These are different levels of failure severity, but all point to the same issue. These drives are more vulnerable in general.
Why Some Drives Fail More
Let’s dive into the technical reasons behind higher hard drive failure rates in our Hard Drive Failure Statistics. Entry-level drives often prioritise affordability, which can lead to:
- Cheaper Materials: Aluminium platters, used in models like the Seagate ST2000LM007, are less durable than glass platters in enterprise drives, making them prone to damage from drops.
- Weaker Magnets: Cost-saving magnets may reduce data stability, increasing risks of corruption.
- Manufacturing Variability: Many entry-level drives are produced in China or Thailand, where quality control can vary, unlike Singapore or Japan for enterprise models.
- Design Trade-Offs: Shingled Magnetic Recording (SMR) in some entry-level drives slows write speeds and may affect reliability compared to Conventional Magnetic Recording (CMR).
Our Hard Drive Failure Statistics show 50% of failures stem from physical damage (e.g., drops), while the other 50% are due to mechanical or electronic issues, often linked to these cost-saving measures.
Entry Level vs. Enterprise Drives: A Technical Comparison
To understand the reliability gap highlighted in our Hard Drive Failure Statistics, here’s a comparison of entry-level and enterprise drives:
| Feature | Entry Level Drives | Enterprise Drives |
|---|---|---|
| Platter Material | Aluminium | Glass |
| Magnet Strength | Weaker | Stronger |
| Spindle Speed | 5400 RPM | 7200 RPM+ |
| Recording Technology | SMR (Shingled Magnetic Recording) | CMR (Conventional Magnetic Recording) |
| Cache Size | 64MB | 256MB+ |
| Manufacturing Location | China, Thailand | Singapore, Japan |
Key Insight: Enterprise drives, such as Western Digital’s Ultrastar or Seagate’s Exos, use advanced technologies like helium-filled enclosures to reduce friction and boost capacity, offering greater reliability, as seen in our Hard Drive Failure Statistics.
Expert Advice from Payam Toloo
Mr Payam Toloo, an industry expert in hard drive data recovery since 1998 and owner of Payam Data Recovery, Australia’s oldest and largest data recovery service, shares his wisdom on avoiding issues seen in Hard Drive Failure Statistics:
“I haven’t had a mechanical hard drive fail in over 15 years. I never move them while powered on, don’t travel with them, and keep them out of reach of my kids and away from table edges. My desktop stays dust free, well ventilated, and powered off when not in use. With care, hard drives can last seven to ten years, but accidents still happen. Theft, fire or flood can destroy everything.
That said, solid state drives are a different story. One of mine failed this year while I was out to lunch, after just three years. Many people think solid state drives do not fail, but they do, just for different reasons. I always back up my important files to the cloud twice a year to make sure nothing is lost if something goes wrong. That habit works for me.”
How to Safeguard Your Data: Lessons from Hard Drive Failure Statistics
Protect your data with these practical steps, informed by our Hard Drive Failure Statistics:
- Handle with Care: Don’t move drives while they’re powered on to avoid physical damage.
- Backup Regularly: Adopt the 3-2-1 rule: three copies on two different media, one off-site.
- Monitor Health: Use tools like CrystalDiskInfo to spot early warning signs.
- Act Quickly: If a drive fails, power it off immediately and contact professionals to avoid worsening the damage. Continued use or unfamiliar tools can turn a recoverable issue into permanent data loss.
Learn how to spot early signs of hard drive failure in this quick video by Techquickie:
Credit: “Hard Drive Failure – How to Tell if Your Hard Drive is Failing” by Techquickie
Here’s another helpful video on identifying hard drive failure signs by Chris Titus Tech:
Credit: “How to Tell if Your Hard Drive is Failing” by Chris Titus Tech
Glossary of Terms
Key terms to understand Hard Drive Failure Statistics:
- Head Crash: When read/write heads scrape platters, causing permanent data loss.
- Bad Sectors: Damaged areas that can’t store data reliably, often causing slowdowns.
- Reallocation: Moving data from bad sectors to spares to maintain integrity.
- SMR (Shingled Magnetic Recording): Overlapping tracks for higher density but slower writes.
- CMR (Conventional Magnetic Recording): Non-overlapping tracks for better performance.
- Helium-Filled Drives: Drives using helium to reduce friction and increase capacity.
- 3-2-1 Backup Rule: Three data copies on two media types, one off-site.
Share This Knowledge: Found these Hard Drive Failure Statistics helpful? Share this article with friends or colleagues to help them protect their data. Contact Payam Data Recovery for expert assistance if you face a drive failure.